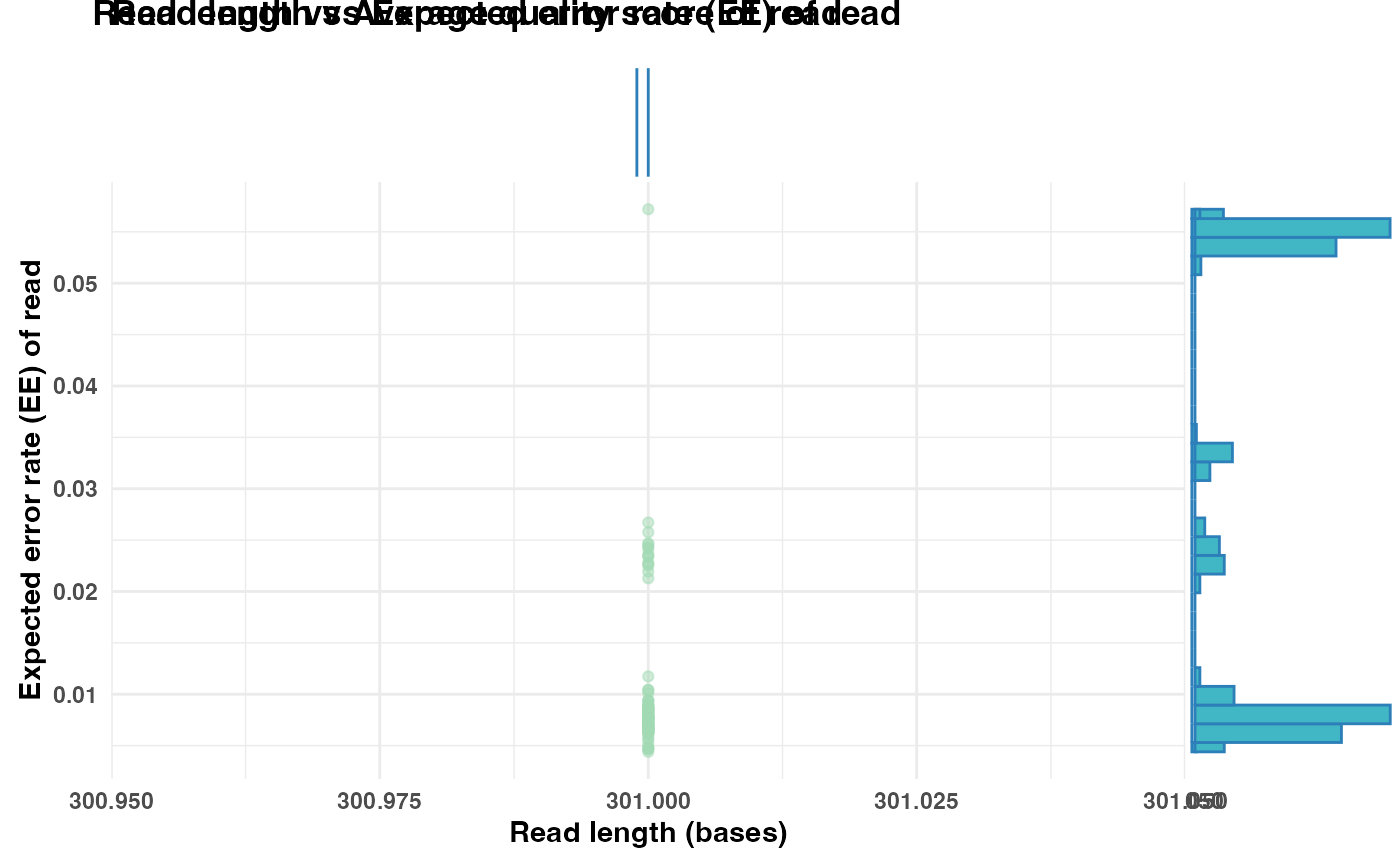
Generates a scatter plot visualizing the relationship between read length and read quality. The y-axis can display either the mean quality score per read or the expected error (EE) rate. Marginal histograms are included to show the distribution of read lengths and quality metrics.
Arguments
- fastq_input
(Required). A FASTQ file path or FASTQ object containing reads. See Details.
- use_ee_rate
(Optional). If
TRUE, the plot will display the expected error rate (EE) on the y-axis instead of the mean quality score. Defaults toFALSE.- plot_title
(Optional). If
TRUE(default), a title will be displayed in the plot. The title will either be "Read length vs Expected error rate (EE) of read" or "Read length vs Average quality score of read", depending onuse_ee_rate. Set toFALSEfor no title.- alpha
(Optional). The transparency level of the points in the scatter plot. Defaults to
0.5.
Details
This function visualizes the relationship between read length and read quality. The user can choose to plot either the mean quality score per read or the expected error (EE) rate.
fastq_input can either be a file path to a FASTQ file or a FASTQ
object. FASTQ objects are tibbles that contain the columns Header,
Sequence, and Quality, see readFastq.
The EE rate is calculated as the mean of error probabilities per read, where the error probability for each base is computed as \(10^{(-Q/10)}\) from Phred scores. A lower EE rate indicates higher sequence quality, while a higher EE rate suggests lower confidence in the read.
Marginal histograms are added to display the distribution of read lengths (top) and quality scores or EE rates (right).
If fastq_input contains more than 10 000 reads, the function will
randomly select 10 000 rows for downstream calculations. This subsampling is
performed to reduce computation time and improve performance on large
datasets.
Examples
# Define arguments
fastq_input <- system.file("extdata/small_R1.fq", package = "Rsearch")

# Generate and display scatter plot with mean quality score on y-axis
p1 <- plot_read_quality(fastq_input = fastq_input)
print(p1)


# (To separate figures in documentation file)
grid::grid.newpage()

# Generate and display scatter plot with mean quality score on y-axis
p2 <- plot_read_quality(fastq_input = fastq_input,
                        use_ee_rate = TRUE)
print(p2)
# (To separate figures in documentation file)
grid::grid.newpage()
# Generate and display scatter plot with mean quality score on y-axis
p2 <- plot_read_quality(fastq_input = fastq_input,
use_ee_rate = TRUE)
print(p2)
